The Great Enrollment Shift: What 5 Years of Data Tells Us About District Growth
Public school enrollment is transforming and these shifts are redrawing the map for EdTech sales territories.

Between the fall of 2019 and the fall of 2024, American public education underwent its most significant enrollment disruption in decades. The pandemic accelerated trends that were already underway and created new patterns that are reshaping which districts are growing, which are shrinking, and where the students went.
For EdTech companies, these enrollment shifts aren't just demographic trivia—they directly affect market sizing, territory planning, and where to focus sales resources. A district that was a top-100 account five years ago may have lost 15% of its students. A fast-growing suburban district may have added three new schools.
This article analyzes what the enrollment data actually shows, what's driving the changes, and what it means for EdTech market strategy.
The National Picture: Where Did 1.5 Million Students Go?
Let's start with the headline numbers.
Fall 2019 public school enrollment: ~50.8 million studentsFall 2023 public school enrollment: ~49.4 million studentsNet change: Approximately -1.4 million students (-2.8%)
That 1.4 million student decline—roughly equivalent to the entire public school population of Arizona—didn't happen evenly. It concentrated in specific places and grade levels, and some districts actually grew substantially during the same period.
Where the Students Went
The enrollment decline distributed across several destinations:
Private schools: Private school enrollment increased by approximately 4% between 2019 and 2023, absorbing several hundred thousand students. Much of this shift happened among families who could afford alternatives during pandemic school closures.
Homeschooling: Homeschool estimates are imprecise (no comprehensive federal tracking), but most analyses suggest homeschooling roughly doubled during the pandemic and remains elevated, with perhaps 5-6% of school-age children now homeschooled compared to 2-3% pre-pandemic.
Charter schools: Charter enrollment grew even as traditional public school enrollment fell. Charters now serve approximately 7.5% of public school students, up from 6.5% before the pandemic.
Population decline: Birth rates have been falling for years. The 2020-2021 period saw particularly low births, which will hit kindergarten enrollment in 2025-2026 and ripple through the system for years.
Migration: Domestic migration patterns shifted during the pandemic, with population flowing from some states to others—affecting school enrollment accordingly.
The Grade-Level Story
The enrollment decline wasn't uniform across grades:
Pre-K and Kindergarten: Hardest hit. Kindergarten enrollment dropped 7-8% in fall 2020 and has only partially recovered. Some families simply held children back a year; others exited the system entirely.
Elementary (K-5): Down 3-4% overall, with the declines concentrated in early grades.
Middle School (6-8): More stable, as these students were already enrolled before the pandemic.
High School (9-12): Relatively stable in counts, though some graduation rate fluctuation occurred.
The kindergarten cohort that shrank in 2020 will ripple through the system—smaller first grade in 2021, smaller second grade in 2022, and so on. Districts are seeing this wave move through their elementary schools.
The Geographic Story: Winners and Losers
National averages obscure dramatic geographic variation. Some regions and states gained enrollment while others declined significantly.
The Sun Belt Surge
States that were already growing continued to grow—often faster:
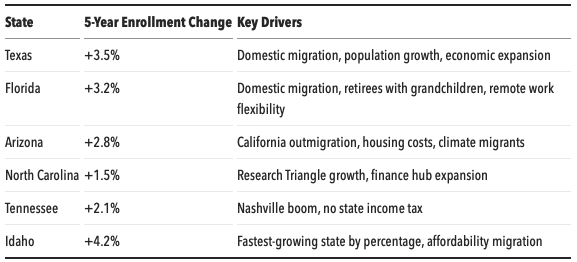
These states are opening new schools, hiring teachers, and expanding budgets—creating EdTech buying opportunities.
The Northeast and Midwest Decline
Conversely, some regions saw accelerated enrollment losses:
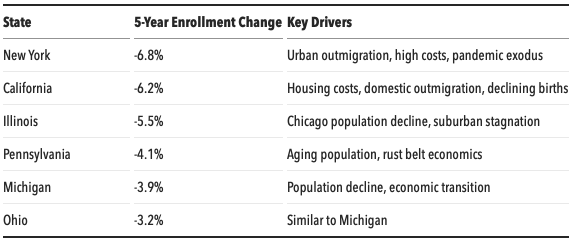
These states face budget pressures as enrollment-driven funding declines. Some are consolidating schools and cutting staff.
The Urban-Suburban-Rural Split
Within states, patterns differ by locale:
Major urban cores: Many saw significant declines. New York City, Los Angeles, Chicago, and other major cities lost substantial enrollment as families moved to suburbs or left regions entirely. Some urban districts are down 10-15% from pre-pandemic levels.
Inner-ring suburbs: Generally stable, with some growth as urban families moved outward.
Outer suburbs and exurbs: The biggest growth areas. Fast-growing districts outside Austin, Phoenix, Nashville, Raleigh, and similar metros are struggling to keep pace with enrollment growth.
Rural areas: Mixed picture. Some rural areas gained as remote work enabled moves from cities. Others continued long-term decline as young families left for opportunities elsewhere.
What's Driving the Shifts?
Multiple factors combined to create the current enrollment landscape:
1. The Remote Work Revolution
Pre-pandemic, job location dictated family location, which dictated school enrollment. When millions of workers gained flexibility to work remotely, housing costs and quality of life began to matter more than commute distance.
Result: Migration from high-cost coastal metros to lower-cost Sun Belt and Mountain West locations. Families with remote-capable jobs could choose districts based on preference rather than proximity to office.
2. Housing Affordability Crisis
Median home prices in some metros reached levels that made family formation financially impossible. When a starter home costs $1.5 million, young families move—or don't form at all.
The housing cost map increasingly correlates with the enrollment decline map.
3. School Response to COVID
Districts that stayed closed longer for in-person instruction saw larger enrollment losses. Families who could afford alternatives (private school, moving, homeschool) exercised those options. Some returned when schools reopened; many didn't.
This wasn't universal—some closed districts retained enrollment while some open districts saw departures—but the overall pattern is clear in the data.
4. Declining Birth Rates
This trend predates the pandemic but continues to intensify. The U.S. birth rate hit record lows in 2020 and 2021, and preliminary 2023-2024 data shows no recovery.
Fewer births today means fewer kindergarteners in five years. Districts in stable or declining population areas will feel this wave for the next decade.
5. Rising Private and Alternative Enrollment
Private school enrollment grew during the pandemic, and much of that growth has persisted. Additionally, charter school expansion continues in most states where it's permitted.
The share of K-12 students in traditional public schools is gradually declining—from about 85% to about 82% over the past decade.
Implications for EdTech Market Strategy
These enrollment shifts have real consequences for market sizing, territory planning, and sales strategy.
1. Your TAM Is Shifting
If you size your market by total public school enrollment, your TAM declined ~3% in four years. But that headline number obscures bigger shifts:
- Enrollment in charter schools (often served differently) grew
- Enrollment in fast-growth states increased while slow-growth states declined
- Your accessible market depends heavily on which states and district types you serve
Action: Regularly re-assess market size using current enrollment data, not assumptions from 2019 snapshots.
2. Growth Districts vs. Decline Districts Require Different Approaches
High-growth districts are:
- Opening new schools (opportunity for new implementations)
- Hiring teachers rapidly (professional development opportunities)
- Managing capacity constraints (efficiency tools have value)
- Spending capital dollars on facilities (sometimes with technology budgets attached)
Declining enrollment districts are:
- Closing or consolidating schools (implementation complexity)
- Managing budget pressure (price sensitivity increases)
- Facing staffing reductions (fewer decision-makers, different priorities)
- Focused on maintaining quality with fewer resources
The same product requires different positioning for growth districts ("scale with you") versus declining districts ("do more with less").
3. Territory Value Has Changed
A sales territory assigned based on 2019 data may no longer make sense. Consider:
- A Texas territory that was "medium" is now meaningfully larger
- A California territory that was a flagship may have shrunk
- Rural territories in growth states may have more potential than before
Action: Re-evaluate territory assignments using current enrollment data, not historical boundaries.
4. New Schools Mean New Opportunities
High-growth districts aren't just adding students—they're building schools. A new school is often:
- A greenfield implementation opportunity (no incumbent vendor)
- Funded with capital dollars (sometimes more flexible than operating budget)
- Run by leaders looking to establish systems (receptive to new solutions)
Action: Track new school openings in growth states as a prospecting signal.
5. Consolidation Creates Disruption
When districts close or merge schools:
- Technology contracts get reviewed and consolidated
- Incumbent vendors may be displaced
- Purchasing decisions may reset
- Staff changes create new decision-maker relationships
Consolidation is painful for communities but can create sales opportunities for vendors positioned as efficiency partners.
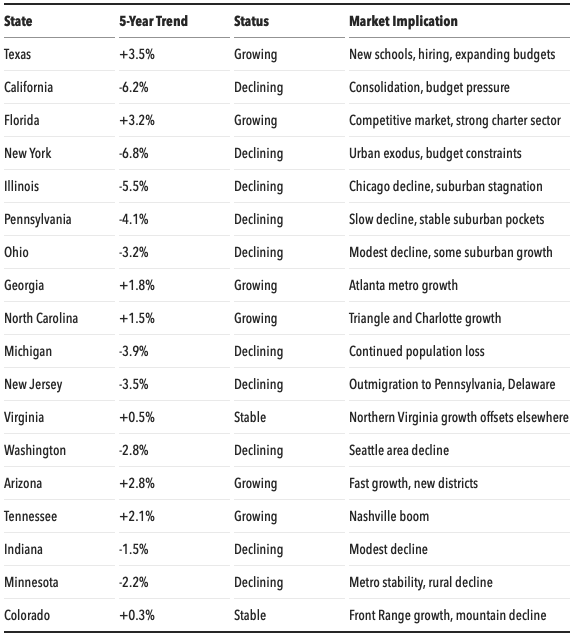
State-by-State Snapshot
Here's a quick reference for enrollment trends in major EdTech markets:
Looking Ahead: What the Data Suggests
Several trends seem likely to continue:
The kindergarten trough continues
Pandemic-era birth rate declines mean small kindergarten classes through at least 2027-2028. Elementary enrollment in many districts will continue declining even if no families leave.
Sun Belt growth persists
Economic and demographic momentum in Texas, Florida, Arizona, Tennessee, and the Carolinas appears durable. These states will continue gaining share of national enrollment.
Urban recovery remains uncertain
Some urban districts are stabilizing; others continue to decline. The long-term post-pandemic equilibrium for big-city districts is not yet clear.
Charter and private share continues growing
Absent major policy changes, the gradual shift away from traditional public schools will continue, particularly in states with school choice programs.
Total enrollment likely declines further
National public school enrollment will probably drop another 1-2% by 2028 based on birth rate trends, even without further shifts to private or home education.
The Bottom Line
The 2019-2024 enrollment shift isn't a temporary pandemic disruption—it's a structural change in American K-12 education. Millions of students have moved, switched sectors, or not been born. The winners and losers are increasingly clear.
For EdTech companies, this data argues for:
- Regular market size updates using current enrollment, not historical assumptions
- Differentiated approaches for growth vs. decline districts
- Increased focus on Sun Belt and high-growth states where enrollment and budgets are expanding
- Attention to new school openings as prospecting signals
- Recognition that urban markets have shrunk relative to suburban and exurban
The districts that were the biggest five years ago aren't necessarily the biggest today. The territories that were richest aren't necessarily richest now. Let the data guide where you invest your sales resources.