The Definitive Guide to NCES Data: What's Available, What's Not, and Why It's 2 Years Old
The federal government's education database is the foundation of district intelligence, but it comes with significant limitations you need to understand

If you've ever tried to research a school district, you've probably encountered NCES data—whether you knew it or not. The National Center for Education Statistics is the primary source of K-12 education data in the United States, and virtually every district profile, market sizing exercise, and territory analysis ultimately traces back to their databases.
But here's what most EdTech sales professionals don't realize: NCES data is both incredibly valuable and frustratingly limited. Understanding what's actually in these datasets—and what's not—separates effective district research from guesswork.
This guide covers everything you need to know about NCES data as a practitioner, not an academic.
---
What Is NCES?
The National Center for Education Statistics is the federal government's primary statistical agency for education. Part of the Institute of Education Sciences within the U.S. Department of Education, NCES collects, analyzes, and publishes data on education in the United States.
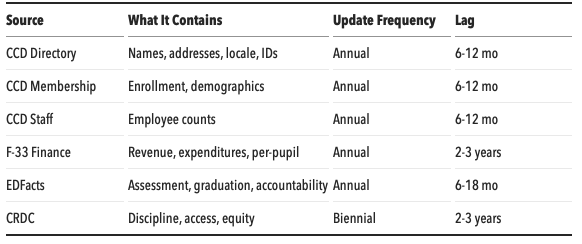
For K-12 specifically, NCES maintains several major data collections:
- Common Core of Data (CCD): The universe file of all public schools and districts
- School District Finance Survey (F-33): Detailed financial data
- EDFacts: Assessment and accountability data
- Civil Rights Data Collection (CRDC): Discipline, access, and equity data
- Private School Universe Survey (PSS): Private school data
For EdTech sales purposes, CCD and F-33 are the workhorses. Let's dig into each.
---
The Common Core of Data (CCD): Your Foundation
The CCD is the Department of Education's primary database of all public elementary and secondary schools and school districts in the United States. It's not a sample—it's an attempt to capture the entire universe of public education.
What CCD Contains
District-Level Data:
- NCES District ID (unique identifier)
- District name and address
- Locale type (city, suburb, town, rural)
- Grade span (what grades the district serves)
- Total enrollment
- Student counts by grade level
- Staffing counts (teachers, other staff)
- Basic operational status
School-Level Data:
- NCES School ID
- School name, address, phone
- School type (regular, special ed, vocational, alternative)
- Grade span
- Enrollment by grade
- Student-teacher ratios
- Title I status
- Magnet/charter status
Demographic Data:
- Enrollment by race/ethnicity
- Free/Reduced-Price Lunch eligibility counts
- English Language Learner counts
- Students with disabilities counts
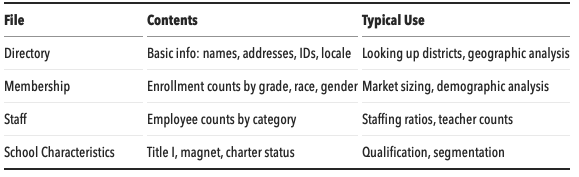
CCD Data Files
NCES publishes CCD data in several files:
The Good News About CCD
Comprehensive coverage: CCD includes virtually every public school district in the country—approximately 13,000+ districts and 100,000+ schools.
Consistent identifiers: NCES IDs are stable over time, making longitudinal analysis possible. The 7-digit district ID and 12-digit school ID are the closest thing to a universal identifier in K-12.
Annual updates: New CCD data is released each year, typically in late summer/fall for the prior school year.
Free and public: All CCD data is freely available for download. No subscription required.
The Bad News About CCD
Data lag: When NCES releases "2023-24" CCD data, they're releasing data that was collected during the 2023-24 school year—meaning by the time you access it (typically fall 2024 or later), it's already 6-12 months old at minimum.
Limited depth: CCD provides breadth (every district) but not depth. You get enrollment and basic demographics, but not academic performance, detailed finances, or operational details.
Self-reported data: Districts report their own data to state agencies, which then report to NCES. Quality control exists, but errors happen.
Definitional variations: What counts as a "school" or "district" varies slightly by state, creating some comparability issues.
---
The F-33 Finance Survey: Following the Money
If CCD is the foundation, F-33 is where the money story lives. The Annual Survey of School System Finances (form F-33) collects detailed financial data from all school districts.
What F-33 Contains
Revenue Data:
- Total revenue
- Federal revenue (broken down by program)
- State revenue (broken down by source)
- Local revenue (property taxes, other local)
- Revenue from other sources
Expenditure Data:
- Total current expenditures
- Instruction expenditures
- Support services expenditures
- Capital outlay
- Interest on debt
- Expenditures by function (administration, operations, transportation, etc.)
Calculated Metrics:
- Per-pupil expenditures
- Per-pupil revenue by source
- Expenditure ratios by category
Why F-33 Matters for Sales
F-33 data tells you:
- Total budget: How much does this district actually spend?
- Per-pupil spending: How does spending compare to peers?
- Revenue mix: What percentage comes from local vs. state vs. federal sources?
- Spending priorities: What share goes to instruction vs. administration vs. support?
These insights inform qualification decisions. A district with high per-pupil spending and strong local revenue has different purchasing capacity than one dependent on state formula funding.
The F-33 Data Lag Problem
Here's the critical issue with F-33: financial data is always old.
The F-33 collection cycle works like this:
- Districts close their fiscal year (usually June 30)
- Districts compile financial reports
- Districts submit to state agencies
- States compile and validate
- States submit to Census Bureau (which administers F-33)
- Census processes, validates, and publishes
This chain takes time. A lot of time.
Typical timeline:
- FY 2023 (ending June 30, 2023) data
- Submitted to Census throughout 2024
- Published by NCES in early 2025
- Available to you in 2025
When you access F-33 data in 2025, you're typically looking at FY 2022 or FY 2023 data—two to three fiscal years behind current reality.
This matters enormously. A lot can change in two years:
- Enrollment shifts affect per-pupil calculations
- Federal pandemic relief funds created temporary budget spikes
- State funding formula changes alter revenue mix
- Bond measures or levy failures change local revenue
Always note the fiscal year of financial data you're using, and remember: it's a historical snapshot, not current reality.
Accessing F-33 Data
F-33 data is published through multiple channels:
NCES EDGE (Education Demographic and Geographic Estimates): Web interface for browsing and downloadingCensus Bureau Public Use Files: Raw data files for downloadUrban Institute Education Data Portal: API access with cleaned, normalized data
The Urban Institute portal is often the most user-friendly option, as they've done significant work to clean and normalize the data.
---
EDFacts: Assessment and Accountability Data
While CCD covers demographics and F-33 covers finances, EDFacts is where academic performance data lives.
What EDFacts Contains
Assessment Data:
- Proficiency rates by subject (math, reading/ELA, science)
- Participation rates
- Results disaggregated by subgroup (race, income, disability, ELL status)
Accountability Data:
- Graduation rates (4-year, extended)
- Dropout rates
- Attendance rates
- School improvement status
Program Data:
- Title I participation
- Special education counts and settings
- English learner program participation
EDFacts vs. State Data
EDFacts aggregates data that states report to the federal government. This creates a standardization benefit—you can compare across states—but also a limitation: the data is only as detailed as federal reporting requirements demand.
For more granular assessment data (like performance by specific test, by grade level, or with more demographic breakdowns), you often need to go directly to state DOE sources.
When to use EDFacts:
- National or multi-state comparisons
- High-level proficiency and graduation metrics
- Subgroup gap analysis
When to go to state sources:
- Detailed performance by grade and subject
- School-level accountability ratings
- State-specific metrics not reported federally
---
The Data Lag Reality: A Summary
Understanding data freshness is critical. Here's a realistic timeline of what you can expect:
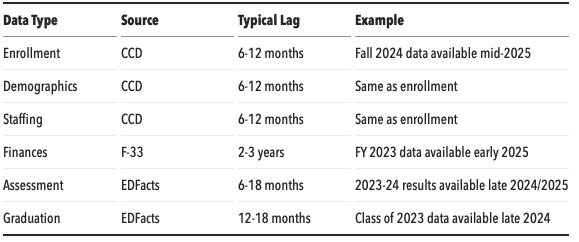
Practical implication: If you're building a district profile using NCES data in January 2026:
- Enrollment data might be from fall 2024
- Financial data might be from FY 2023 (ending June 2023)
- Assessment data might be from 2023-24 school year
You're working with a composite picture where different data points come from different time periods.
---
Navigating the NCES Data Infrastructure
Accessing NCES data isn't always intuitive. Here's a practical guide to the key resources:
NCES Website (nces.ed.gov)
The main portal for all NCES data. Key sections:
Data Tools:
- Elementary/Secondary Information System (ELSi): Build custom tables from CCD data
- School District Demographics System: Geographic and demographic data
- District Finance Peer Search: Compare district finances to peers
Data Downloads:
- Raw data files in various formats (CSV, SAS, SPSS)
- Documentation and codebooks
- Crosswalks between years
Common Access Challenges
Challenge 1: Finding the right file
NCES publishes many files with similar names. "Directory" vs. "Membership" vs. "Characteristics"—knowing which file contains what you need requires familiarity with their structure.
Solution: Start with the documentation. Each data collection has a "file layout" or "data dictionary" that explains exactly what's in each file.
Challenge 2: Dealing with file formats
Raw NCES files often come in formats (SAS, SPSS) that require specialized software, or in CSV files with cryptic column headers.
Solution: Use intermediary tools like the Urban Institute's Education Data Portal, which provides API access with cleaner documentation.
Challenge 3: Merging across files
To build a complete district profile, you often need to combine data from multiple files (directory + membership + finance). This requires matching on NCES IDs and handling different year references.
Solution: Build a systematic process for merging, or use platforms (like EduSignal) that have already done this integration work.
Challenge 4: Understanding codes
NCES uses numeric codes for many categorical variables (locale codes, status codes, etc.). Raw data shows "21" where you want to see "Suburban: Large."
Solution: Always reference the codebook when working with raw files.
---
What NCES Doesn't Have
Understanding the gaps in NCES data is just as important as knowing what's there:
Not in NCES:
Technology inventory: No federal database tracks what software, hardware, or EdTech products schools use.
Contract and procurement data: NCES doesn't track what districts buy or from whom.
Leadership contacts: No names, emails, or phone numbers for administrators.
Curriculum details: What textbooks or curriculum programs are in use isn't tracked.
Real-time enrollment: Everything is historical, typically a year or more old.
Student-level data: All NCES data is aggregated. Individual student records are protected.
Private school finances: The Private School Universe Survey covers basic demographics, not detailed finances.
Charter school details: Charters are included in CCD, but authorizer relationships and financial details beyond basics aren't captured.
Where to Fill the Gaps
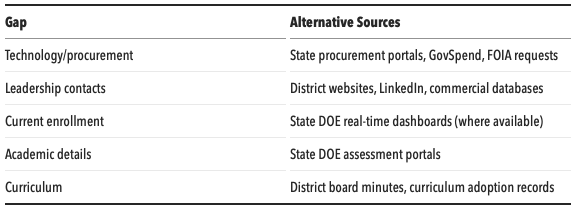
---
Best Practices for Using NCES Data
1. Always Note the Data Year
When citing NCES data, always specify what year you're referencing. "This district has 15,000 students" should be "This district had 15,000 students as of fall 2024 (CCD)."
2. Triangulate When Possible
For important prospects, cross-reference NCES data with state DOE data and district websites. Discrepancies happen, and more current sources may be available.
3. Understand What You're Comparing
When comparing districts across states, remember that some variations are real (different funding levels) while others are definitional (different grade configurations, different categorization of schools).
4. Use the Lag Strategically
The data lag can actually be useful. F-33 data showing high per-pupil spending from two years ago likely indicates a district that still has resources today (barring major changes). Historical patterns tend to persist.
5. Build Processes, Not One-Off Lookups
If you regularly need district data, invest in building repeatable processes for accessing and cleaning NCES data—or use tools that have already done this work.
---
The Bottom Line
NCES data is the foundation of K-12 market intelligence. Its comprehensiveness (covering every public district) and consistency (standard definitions, stable IDs) make it irreplaceable for any serious district research.
But it comes with real limitations:
- Financial data is always 2+ years old
- Depth is limited (demographics and finances, not operations)
- Access requires technical proficiency or intermediary tools
The best EdTech sales professionals understand both the value and the limitations of NCES data. They use it as a foundation, supplement it with fresher state-level data, and always remember that the numbers represent a historical snapshot—not today's reality.
---
Quick Reference: NCES Data Sources